Study › Amateur Extra › E9G

E9G

ANTENNAS AND TRANSMISSION LINES

The Smith chart

Drill results are kept in this browser. Log in to keep them on your account and get a study plan.

E9G011 of 11

Which of the following can be calculated using a Smith chart?

Why The Smith chart is a polar plot of the complex reflection coefficient overlaid with normalized resistance and reactance circles. Moving around the chart's constant-SWR circle corresponds to moving along a transmission line, so you can transform a load impedance to the impedance seen at any point on the line, and also work out matching networks and SWR. That impedance transformation along a line is its core purpose.
Watch out Radiation resistance, radiation patterns and propagation predictions all depend on antenna geometry, ground and the ionosphere, none of which the Smith chart models; it only handles impedance and reflection along a line.
Smith chart = transmission line slide rule: impedance, SWR and matching, never patterns or propagation.
HamSandwich explanation, first draft. The question and answers are the NCVEC text.
E9G022 of 11

What type of coordinate system is used in a Smith chart?

Why The Smith chart is a graphical plot of the complex reflection coefficient, but it is overlaid with a grid of normalized impedance. Points of constant resistance form complete circles, and points of constant reactance form arcs that run off toward the edge, so any impedance R + jX plots where its resistance circle crosses its reactance arc. Values are normalized to the line impedance, so the center of the chart is 1.0 (a perfect match, typically 50 ohms).
Watch out The choices mentioning voltage and current are wrong because the chart's grid is impedance based, not a plot of instantaneous voltage or current; and nothing on a Smith chart is drawn as straight lines or chords, the curves are circles and arcs.
Smith chart = R circles + X arcs. Resistance makes full circles, reactance makes arcs curving to the rim.
HamSandwich explanation, first draft. The question and answers are the NCVEC text.
E9G033 of 11

Which of the following is often determined using a Smith chart?

Why The Smith chart is a graphical calculator whose coordinates are the normalized resistance and reactance circles of a transmission line, so it lets you plot a complex impedance and rotate it along constant-SWR circles to see how impedance transforms with line length. That makes it a tool for solving transmission line problems: finding the impedance seen at the input of a line, designing matching networks, and reading SWR directly as the radius of the plotted circle. Everything on the chart is about impedance, reflection coefficient and SWR.
Watch out Beam headings and satellite azimuth/elevation come from great-circle or orbital calculations, and propagation reliability versus frequency comes from HF prediction software; none of those use the resistance/reactance coordinate system that defines the Smith chart.
Smith chart = impedance chart. Circles of R and arcs of X, with SWR read off the circle radius.
HamSandwich explanation, first draft. The question and answers are the NCVEC text.
E9G044 of 11

What are the two families of circles and arcs that make up a Smith chart?

Why A Smith chart is a graphical plot of normalized complex impedance, Z = R + jX. The full circles printed on it are lines of constant resistance, and the arcs that curve off the horizontal axis are lines of constant reactance (positive/inductive above the centerline, negative/capacitive below). Reading where a resistance circle crosses a reactance arc gives you the impedance at that point on a line.
Watch out Inductance and capacitance is tempting because the upper and lower halves of the chart are inductive and capacitive, but the chart is scaled in ohms of reactance, not in henries or farads, and inductance/capacitance ignores the resistance family entirely.
Smith chart = R circles + X arcs, because it plots Z = R + jX.
HamSandwich explanation, first draft. The question and answers are the NCVEC text.
E9G055 of 11

Which of the following is a common use for a Smith chart?

Why The Smith chart is a graphical map of the complex reflection coefficient overlaid with normalized resistance and reactance circles, so moving along a transmission line is just rotating around the chart center. That makes it ideal for stub matching: you rotate from the load toward the generator until you land on the unity-resistance circle, which fixes the stub's position, then read the reactance you must cancel to get the stub's length. Working these problems graphically is the classic textbook use of the chart.
Watch out Finding a line's characteristic impedance from conductor diameter and spacing, or its loss per 100 feet from materials and velocity factor, comes from formulas or manufacturer data tables, not from the chart, and antenna gain is not a transmission line impedance problem at all.
Smith chart = impedance along a line. Rotate toward the generator, add a stub. Anything about physical dimensions or loss is not it.
HamSandwich explanation, first draft. The question and answers are the NCVEC text.
E9G066 of 11

On the Smith chart shown in Figure E9-3, what is the name for the large outer circle on which the reactance arcs terminate?
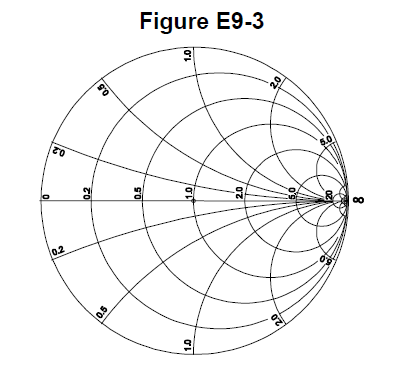
Figure E9-3 from the NCVEC question pool
Why On a Smith chart the family of curved reactance arcs all begin and end on the big circle that bounds the chart, so that outermost circle is called the reactance axis. It represents the locus of zero resistance (pure reactance), which is why every arc of constant reactance terminates there. The straight horizontal line through the middle is the other principal axis, the resistance axis, where reactance is zero.
Watch out The choice naming it the resistance axis fits the straight horizontal center line, not the outer circle, and 'prime axis' and 'polar axis' are not Smith chart terms at all.
Curved reactance arcs end on the curved outer circle: reactance axis. Straight line across the middle: resistance axis.
HamSandwich explanation, first draft. The question and answers are the NCVEC text.
E9G077 of 11

On the Smith chart shown in Figure E9-3, what is the only straight line shown?

Figure E9-3 from the NCVEC question pool
Why On a Smith chart every constant-reactance curve is an arc of a circle, and every constant-resistance contour is a full circle tangent to the chart's outer rim. The single exception is the horizontal line running through the center from the short-circuit point to the open-circuit point, which is the pure-resistance (zero reactance) locus. A straight line is just a circle of infinite radius, and that is the only one drawn on the chart.
Watch out The reactance axis is tempting because it is the other named axis, but reactance appears as curved arcs sweeping off the outer circle, inductive above the center line and capacitive below.
Straight and level across the middle = pure resistance, no reactance. Everything else on a Smith chart curves.
HamSandwich explanation, first draft. The question and answers are the NCVEC text.
E9G088 of 11

How is a Smith chart normalized?

Why A Smith chart is drawn in normalized units, where every impedance is divided by the characteristic impedance of the system. The prime center, the point at the middle of the resistance axis, is assigned that reference impedance value (1.0 normalized, typically 50 ohms in amateur work), and all other chart readings scale from it. To get actual impedance, multiply the chart reading by the value you gave the prime center.
Watch out The choices about swapping the resistance and reactance axes describe nothing real: those two axes are fixed features of the chart's coordinate system and are never reassigned to each other.
Normalize = set the prime center to Z0 (usually 50 ohms); the center is always 1.0.
HamSandwich explanation, first draft. The question and answers are the NCVEC text.
E9G099 of 11

What third family of circles is often added to a Smith chart during the process of designing impedance matching networks?

Why The printed Smith chart itself contains two orthogonal families: constant-resistance circles and constant-reactance arcs. When you use the chart to design a matching network, you typically draw circles centered on the chart's prime center (1.0 normalized); every point on such a circle has the same standing wave ratio. Those constant-SWR circles let you see at a glance whether a trial matching element brings the load inside your target SWR, and moving along a lossless line simply rotates you around one of them.
Watch out Line length is shown on the chart, but as the wavelength scales around the rim and rotation angle, not as a family of circles, so the transmission line or coaxial length choices describe markings that are not circles. Radiation patterns have nothing to do with the Smith chart at all.
Smith chart families: resistance circles, reactance arcs, and SWR circles centered on the middle. Rotate around center = constant SWR.
HamSandwich explanation, first draft. The question and answers are the NCVEC text.
E9G1010 of 11

What do the arcs on a Smith chart represent?

Why A Smith chart is a plot of the complex reflection coefficient overlaid with two families of curves from the normalized impedance grid. The complete circles are the constant-resistance family, and the arcs that branch off the outer edge and converge on the right-hand point are the constant-reactance family. Reading where a point falls tells you R + jX at once: which circle gives resistance, which arc gives reactance. Arcs above the centerline are inductive (+jX), those below are capacitive (-jX).
Watch out The choice saying constant resistance describes the other family on the chart, the closed circles; only the resistance circles are complete circles, the reactance curves are arcs.
Circles = Resistance (both round), Arcs = reActance. SWR is read on a circle you draw yourself, not printed.
HamSandwich explanation, first draft. The question and answers are the NCVEC text.
E9G1111 of 11

In what units are the wavelength scales on a Smith chart calibrated?

Why The outer rim of a Smith chart carries two scales, "wavelengths toward generator" and "wavelengths toward load," running from 0 to 0.5. They are graduated in fractions of an electrical wavelength on the transmission line, because impedance repeats every half wavelength as you move along the line. Moving a given fraction of a wavelength along the line corresponds to rotating that same fraction around the chart (a full trip around equals 0.5 wavelength).
Watch out The choices mentioning frequency are wrong because the chart is normalized and frequency independent; the antenna wavelength choice confuses the load with the line, and it is the line's electrical length, including its velocity factor, that the scale tracks.
Smith chart rim = wavelengths toward generator/load, 0 to 0.5, on the LINE. Line plus wavelength, not antenna, not frequency.
HamSandwich explanation, first draft. The question and answers are the NCVEC text.
Icom IC-7300 HF/50MHz Base TransceiverSponsored · View on Amazon →Baofeng BF-F8HP Pro Dual Band HandheldSponsored · View on Amazon →
← E9F All groups E9H →